
Data Science Portfolio: Productivity Analysis
About Me
Passionate about technology, innovation, and data-driven decision-making within finance and business. Diverse experiences include logistics and project management, honing skills through leading roles in project event production, business intelligence and IT analysis.
Skilled in Python, SQL, Tableau, and machine learning, committed to driving excellence through problem-solving and adaptability. Eager to contribute expertise to impactful projects at the intersection of technology, finance, and innovation, leveraging entrepreneurial spirit for tangible results.
With a solid foundation in data analysis, I'm poised to apply insights and drive growth in tech companies, banks, financial management firms, and import/export companies.
Eliel Almeida
Click on my Picture to view my LinkedIn Profile
Project Overview
This dataset includes important attributes of the garment manufacturing process and the productivity of the employees which had been collected manually and also been validated by the industry experts.
The project demonstrates advanced capabilities in machine learning and neural networks using SKLearn and TensorFlow, with OS and Dotenv for operational optimization.
The goal is to create an Algorithmic Machine Learning Model based on easily accessible business features. I built an in-depth Data Analysis with Interactive Graphs using Tableau to investigate productivity drivers.
I also formatted a Database where data can be stored, organized, related, secured and distributed using SQL and frameworks such as SQLAlchemy and MySQLConnector.
This dataset includes important attributes of the garment manufacturing process and employee productivity, collected manually and validated by industry experts. Productivity is defined as Total Output divided by Total Input (quantity per hour divided by total cost per hour).
The data was cleaned and formatted using Pandas, with Matplotlib and Seaborn for visualization. Click the GitHub logo to view the repository:
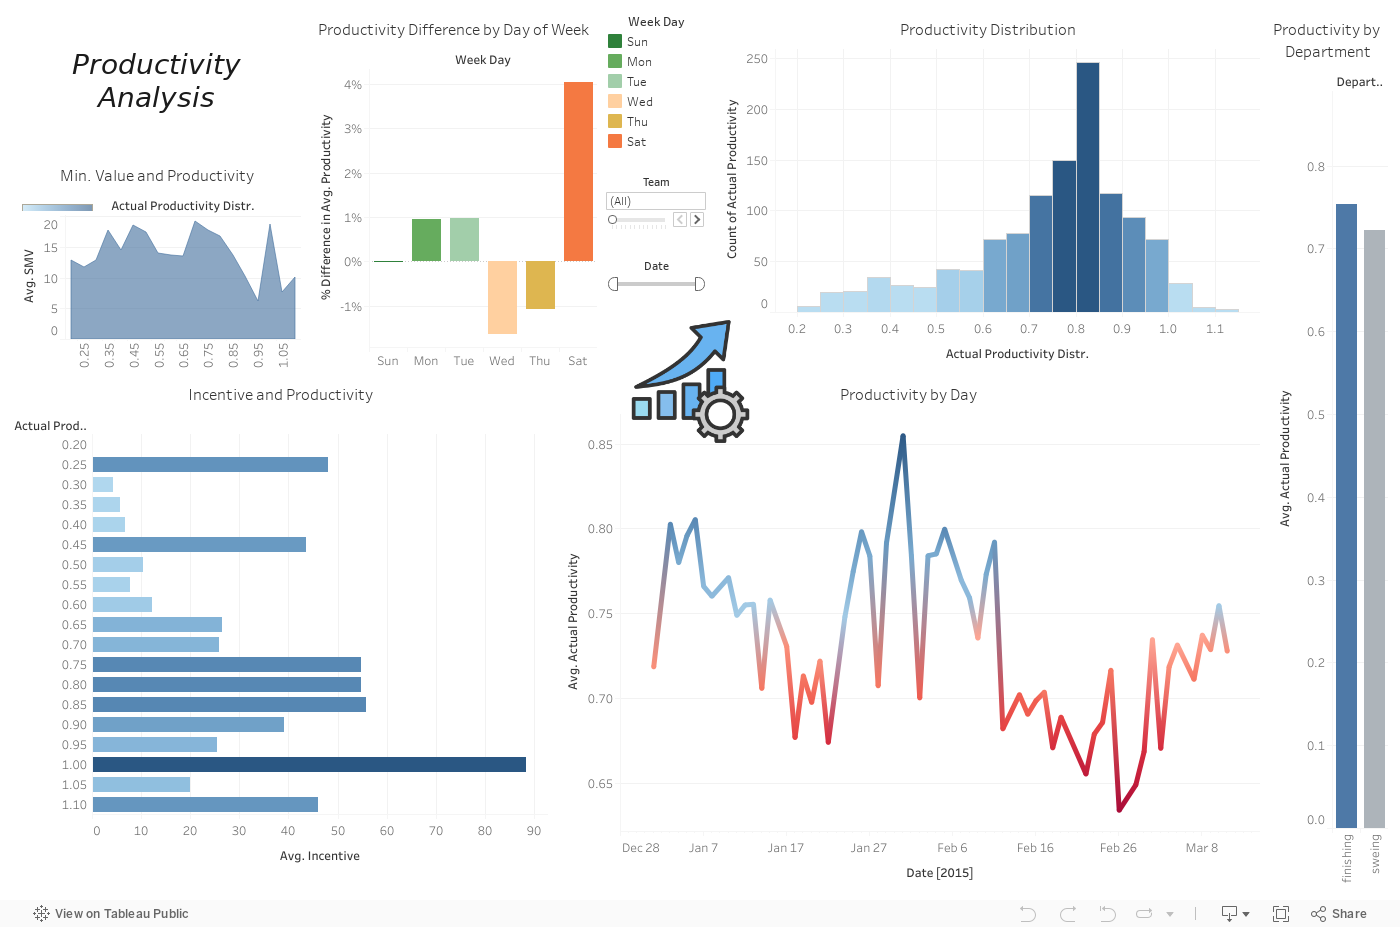
Interactive Data Analysis Dashboard
Machine Learning Productivity Prediction
This data was a obtained in the UC Irvine Machine Learning Repository, and there is a article published in International Journal of Business Intelligence and Data Mining on the mining process. Defining the metrics is essential, what productivity means here is: To tell you how efficiently and effectively your workforce is delivering results over a set period. Therefore having Total Output divided by Total Input we can find Productivity, since it is a garment manufacturing company we can assume that is quantity per hour divided by the total cost per hour.
The model is working without any overfitting issues, in full capacity outperforming the benchmark which is a MIT licensed study (see GibHub for links toIrvine Website, Mining Study and Benchmark). Please fill it up and test yourself, here is a description of the features: